Data Flow Monitoring
The Data FLow Monitoring node offers the possibility to validate if data groups are passing the node at a specified rate.
Configuration
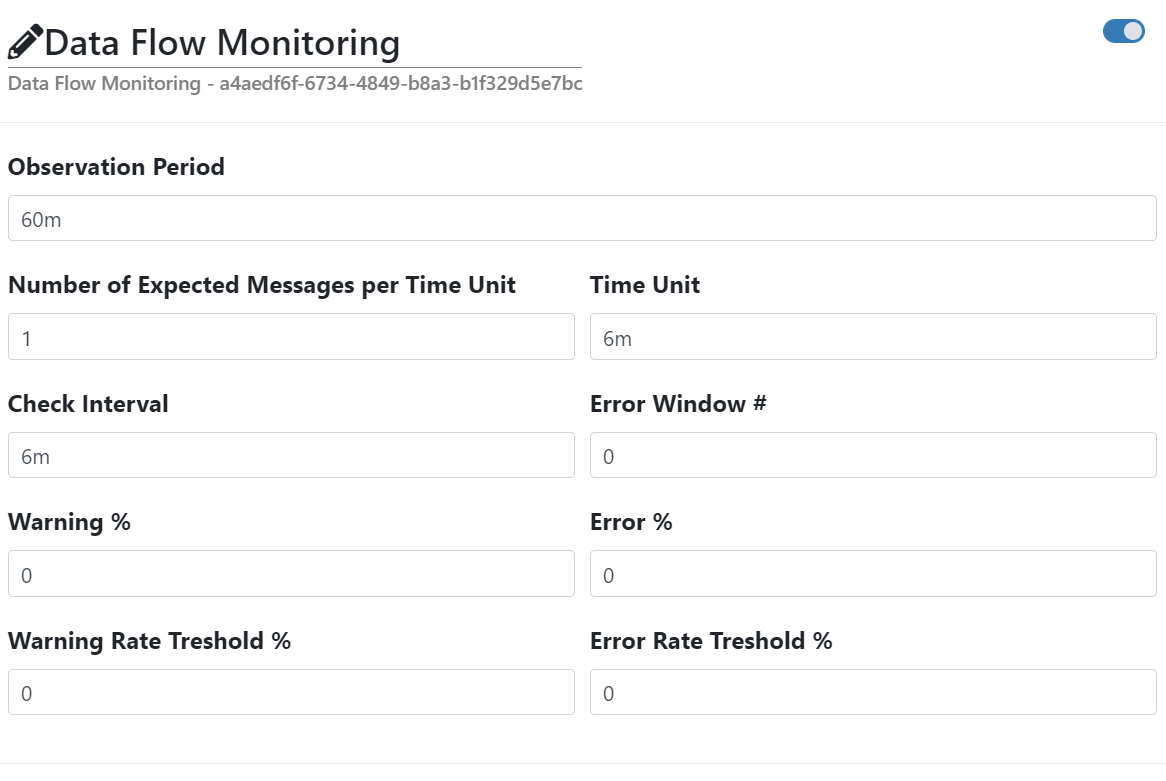
- Observation Period
The period of time where incoming data are observed
Default: 60m
- Number of Expected Messages per Time Unit
The number of expected messages for the given Time Unit
Default: 1
- Time Unit
The time unit for the Number of Expected Messages per Time Unit
Default: 6m
- Check Interval
How often the incoming data will be checked
Default: 6m
- Error Window #
The number of check results to use for the monitoring state.
Default: 0
- Warning %
The check will be in warning state if number of arrived data in the Observation Period is below the Number of Expected Messages per Time Unit in Warning %
Default: 0
- Error %
The check will be in error state if number of arrived data in the Observation Period is below the Number of Expected Messages per Time Unit in Error %
Default: 0
- Warning Rate Threshold %
If the rate of warnings is above this value for the last
Error Window #checks the monitoring will be in warning state.Default: 0
- Error Rate Threshold %
If the rate of errors is above this value for the last
Error Window #checks the monitoring will be in error state.Default: 0